
Setting up AWS Cloudwatch with EC2
25 March 2021
Introduction
Although serverless applications become very popular nowadays, EC2 is still used quite a bit in some use cases. And if we have many EC2 instances, we need to centralize monitoring. To simplify and centralize the process of monitoring AWS services, there is Amazon CloudWatch.
Amazon CloudWatch allows you to monitor Amazon Web Services (AWS) resources and applications in real time. You can use CloudWatch to collect and track metrics, which are the variables you can measure about your resources and applications. A metric represents a time-ordered series of data that is published to CloudWatch. For example, the CPU usage of a given EC2 instance is a metric provided by Amazon EC2. There are thousands of types of metrics such as current processor load, occupied operating memory, occupied disk space, etc. In this tutorial we are going to create 2 metrics such as occupied disk space and available working memory.
It will also help you to understand how we can simply enable and configure the CloudWatch service to monitor EC2 instances using Terraform. In addition to how to configure budget alarms that will notify you as soon as you exceed the established usage limit.
Another important part of CloudWatch is CloudWatch Logs, which allows you to centralize the logs of all AWS systems, applications, and services in a single log. Logs are created from the files established as data sources. In this tutorial we are going to create the logs using two files amazon-cloudwatch-agent.log and */var/log/**.log,*but it is fully customizable and regular expressions can be used to capture the files that are needed.
Creating EC2 instances with Terraform
*Amazon EC2 (Elastic Cloud Computing)*allows users to create virtual machines (servers) according to their needs. We can define the cores and memory of the servers, disk type, operating system and basically, you can do whatever you want with them. As if it were your own physical computer, but in the cloud. You can, for example, install the required software you need and host a website.
Although you can create AWS instances manually through the graphical interface of the AWS console, in a real environment it is much more useful to use automation tools such as Ansible or Terraform, which also allow us to store the configuration and its changes. In this tutorial we are going to see how you can use Terraform to power AWS EC2 instances with CloudWatch Logs. To know what Terraform is and how you can easily create an EC2 instance, I advise you to watch the tutorial “First steps with Terraform – create an EC2 instance in AWS”.
In this tutorial we focus on how to create an instance that has the CloudWatch service activated. In order to collect logs and metrics from different EC2 instances, a CloudWatch Agent program must be installed on each instance. We can simplify the process and do it automatically using Terraform.
# Configuration with Terraform
To have all the code in a specific place we create a new folder and a file main.tf with the content like this:
// Set the AWS provider
provider "aws" {
region = "eu-west-1"
}
// Create a local variable containing the separate Bash script
locals {
userdata = templatefile("userdata.sh", {
  ssm_cloudwatch_config = aws_ssm_parameter.cw_agent.name
})
}
// Create an EC2 instance and pass the user-data script and SSH key (MyKey)
resource "aws_instance" "this" {
ami                  = "ami-096f43ef67d75e998"
instance_type        = "t3.micro"
iam_instance_profile = aws_iam_instance_profile.this.name
user_data            = local.userdata
key_name             = "MyKey"
tags                 = { Name = "EC2-with-cw-agent" }
}
// Store the CloudWatch Agent configuration file in the SSM parameter
resource "aws_ssm_parameter" "cw_agent" {
description = "Cloudwatch agent config to configure custom log"
name        = "/cloudwatch-agent/config"
type        = "String"
value       = file("cw_agent_config.json")
}
// Create a log group to use in the CloudWatch Agent configuration file
resource "aws_cloudwatch_log_group" "LogGroup_1" {
name = "application_logs"
  // Posibles valores: 1, 3, 5, 7, 14, 30, 60, 90, 120, 150, 180, 365, 400, 545, 731, 1827, 3653, and 0.
// If you choose 0, log events will be retained forever
retention_in_days = 1
// tags - (Optional) Tags used to distinguish log groups
tags = {
  Environment = "production"
  Application = "AWS Tutorial"
}
}
// Create the log stream for system logs
resource "aws_cloudwatch_log_stream" "syslog" {
name = "Syslog"
// The log group to which the log stream is assigned
log_group_name = aws_cloudwatch_log_group.LogGroup_1.name
}
// Create another log stream for CloudWatch Agent logs
resource "aws_cloudwatch_log_stream" "cloudwatchlogs" {
  name = "Cloudwatch"
  log_group_name = aws_cloudwatch_log_group.LogGroup_1.name
}
# Explaining the Terraform script
This Terraform script basically does 3 things:
- Create a local variable to load the user_data script using the templatefile function. This script will run when the instance is provisioned, leaving the agent configuration ready for execution. Within the script we pass the name of the CloudWatch Agent configuration file as a parameter. Alternatively, we could build a base image (AMI) that already has the agent installed and configured for the application we are going to deploy, saving time in provisioning the machine, very useful when we work with applications that need to scale very quickly.
- Create an EC2 instance, configuring the instance profile and user_data local variables.
- We create the SSM parameter resource (AWS Security Systems Manager Parameter Store), to load the Cloudwatch Agent configuration file cw_agent_config.json and pass its name to the user_data script. Using the SSM parameter allows us to save the cw_agent_config.json file and use its name within the user_data script. SSM parameters allow us to save configuration variables in a safe and simple way.
# The user_data.sh script
Let's see the user_data script in detail. This script is executed upon launching our EC2 instance with the following content:
#! /bin/bash
set -e

# Print all CloudWatch Agent logs
exec > >(tee /var/log/user-data.log|logger -t user-data-extra -s 2>/dev/console) 2>&1

# Update installed packages
yum update -y
yum upgrade -y

# Install the CloudWatch Agent
wget https://s3.amazonaws.com/amazoncloudwatch-agent/amazon_linux/amd64/latest/amazon-cloudwatch-agent.rpm
rpm -U ./amazon-cloudwatch-agent.rpm

# Use the CloudWatch SSM configuration passed through the SSM parameter
/opt/aws/amazon-cloudwatch-agent/bin/amazon-cloudwatch-agent-ctl \
-a fetch-config \
-m ec2 \
-c ssm:${ssm_cloudwatch_config} -s
What the bash script does are a few simple steps as shown below:
- We print all CloudWatch Agent logs to the specified location.
- We update the machine with the yum. command
- We install the CloudWatch agent.
- Finally, we configure the CloudWatch agent using the configuration file that we passed as parameter ssm_cloudwatch_config.
Configure AWS policies
Applications must sign their API requests with AWS credentials. Therefore, we need a strategy to manage credentials between different EC2 instances. However, distributing credentials to each instance securely poses many problems. But AWS has a very powerful mechanism which is IAM roles (Identity and Access Management) to solve this problem. Instead of creating and distributing AWS credentials, we can delegate permission to make API requests using IAM roles. For example, we can use IAM roles to grant permissions to applications running on our instances that need to use a bucket in Amazon S3. To specify permissions for IAM roles, we create a policy in JSON format. An IAM policy must grant or deny permissions to use one or more actions with AWS resources. Also, you must specify the resources that can be used with the action: these can be all resources or, in some cases, specific resources. The policy may also include conditions that apply to the resource.
# Configuring roles/policies using Terraform
So that our EC2 instance can send the metrics and logs to the CloudWatch repository we have to define the AWS instance profile for this instance. The EC2 instance profile is a container for an IAM role. To configure the CloudWatch agent, we use the SSM (Security Session Manager) parameter. So we have to add the AmazonEC2RoleforSSM policy to be able to access it. In the same folder we create a Terraform file instance_profile.tfwith the following content:
// Create two variables containing the policy names
locals {
role_policy_arns = [
  "arn:aws:iam::aws:policy/service-role/AmazonEC2RoleforSSM",
  "arn:aws:iam::aws:policy/CloudWatchAgentServerPolicy"
]
}
// Create the EC2 instance profile using the role defined below
resource "aws_iam_instance_profile" "this" {
name = "EC2-Profile"
role = aws_iam_role.this.name
}

// Add policies for SSM connectivity and the CloudWatch Agent
resource "aws_iam_role_policy_attachment" "this" {
count = length(local.role_policy_arns)
role       = aws_iam_role.this.name
policy_arn = element(local.role_policy_arns, count.index)
}
// Create an inline policy for the role
resource "aws_iam_role_policy" "this" {
name = "EC2-Inline-Policy"
role = aws_iam_role.this.id
policy = jsonencode(
  {
    "Version" : "2012-10-17",
    "Statement" : [
      {
        "Effect" : "Allow",
        "Action" : [
          "ssm:GetParameter"
        ],
        "Resource" : "*"
      }
    ]
  }
)
}
// Define the role
resource "aws_iam_role" "this" {
name = "EC2-Role"
path = "/"

assume_role_policy = jsonencode(
  {
    "Version" : "2012-10-17",
    "Statement" : [
      {
        "Action" : "sts:AssumeRole",
        "Principal" : {
          "Service" : "ec2.amazonaws.com"
        },
        "Effect" : "Allow"
      }
    ]
  }
)
}
- We create an instance profile, the reference name should be the same as the Terraform script above.
- We add two policies to our role: AmazonEC2RoleForSSM which allows EC2 to communicate with the SSM service and CloudWatchAgentServerPolicy which allows EC2 to communicate with the CloudWatch service.
- We create a custom policy for our role that allows EC2 to make calls to the SSM service (ssm: GetParameter). The main reason we need this permission is that we want the CloudWatch agent to load the configuration from the SSM service parameter, and we need to include this permission which is not included in the AmazonEC2RoleForSSM role.
- Finally, the script will create the role policy for ec2.amazonaws.com (EC2).
Configure AWS CloudWatch
In this step, we will create the Cloudwatch agent configuration file, the configuration will tell the agent how to extract the logs and metrics.
We create a file cw_agent_config.json in the same folder with the following content:
{
"agent": {
  "metrics_collection_interval": 60,
  "logfile": "/opt/aws/amazon-cloudwatch-agent/logs/amazon-cloudwatch-agent.log"
},

"metrics": {
  "metrics_collected": {
    "disk": {
      "resources": ["/", "/tmp"],
      "measurement": ["disk_used_percent"],
      "ignore_file_system_types": ["sysfs", "devtmpfs"]
    },
    "mem": {
      "measurement": ["mem_available_percent"]
    }
  },
  "aggregation_dimensions": [["InstanceId", "InstanceType"], ["InstanceId"]]
},
"logs": {
  "logs_collected": {
    "files": {
      "collect_list": [
        {
          "file_path": "/opt/aws/amazon-cloudwatch-agent/logs/amazon-cloudwatch-agent.log",
          "log_group_name": "amazon-cloudwatch-agent.log",
          "log_stream_name": "amazon-cloudwatch-agent.log",
          "timezone": "UTC"
        },
        {
          "file_path": "/var/log/**.log",
          "log_group_name": "syslog",
          "log_stream_name": "syslog",
          "timezone": "Local"
        }
      ]
    }
  }
  }
}
The JSON file configures the CloudWatch agent to collect metrics every 60 seconds and collect the disk_used_percent metric, the mem_available_percent. metric.
# Explaining the Cloudwatch Agent configuration file
To have CloudWatch Agent collect system logs or any other files, including your application's trace files, you can define the collect_list array within the logs section and set the entries for each log file.
-
file_path: Specifies the path of the log file to upload to CloudWatch Logs. Standard Unix glob comparison rules are accepted, with the addition of ** as a super asterisk. For example, specifying /var/log/**.log causes all .log files within the /var/log folder to be collected;
-
log_group_name: the group name where the file logs will appear;
-
log_sream_name: the name of the log stream to which the file logs are assigned;
-
multi_line_start_pattern:specifies the pattern in regular expression (regex) form to identify the start of a log message. A log message consists of a line that matches the pattern and subsequent lines that do not match the pattern. If you omit this field, multiline mode is disabled and any line that begins with a character other than a space closes the previous log message and starts a new log message. If you include this field you can use the date format set in the date_time_format field like this{date_time_format} to identify the start of the log message .
-
date_time_format: the date format for the log message. If you omit this field, the current time is used. Text and special symbols starting with % are used, for example '%d-%b-%Y %H:%M:%S UTC'
To know all the CloudWatch Agent configuration options you can see them in the official AWS documentation.
Finally, we can now test our Terraform configuration by running the following command inside our folder:
terraform apply --auto-approve
And you should see a new EC2 instance in your account. Let EC2 run for a few minutes to generate enough metrics and go to the AWS console.
Using AWS Cloudwatch
To view Cloudwatch metrics and logs you have to go to the AWS console, then Cloudwatch -> Metrics.
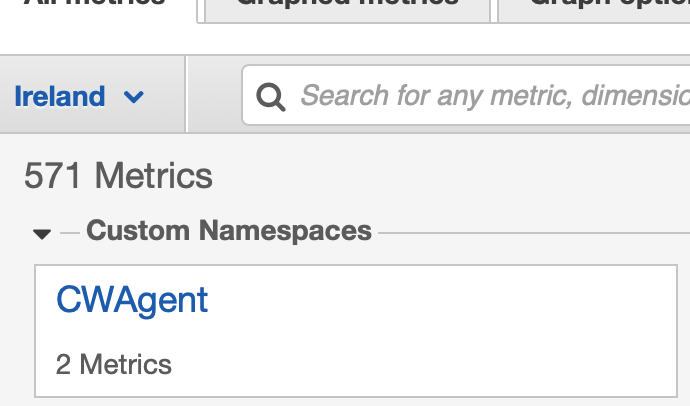
We see the custom space where our metrics are.
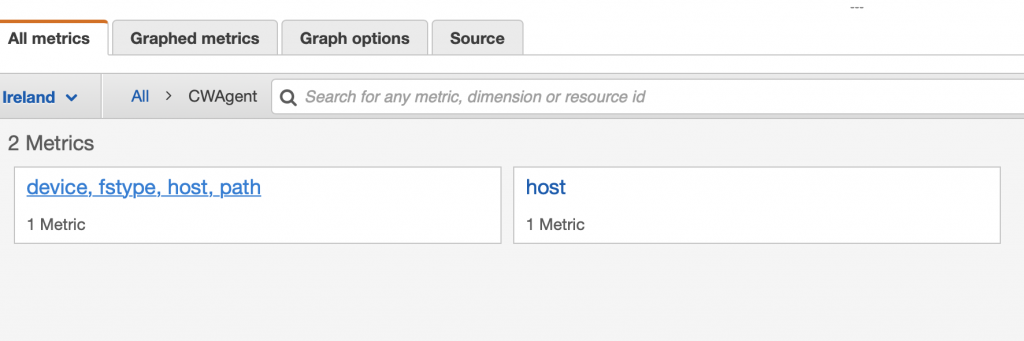
If you enter the CWAgent space (default name, can be changed) the metrics that you can see will appear.
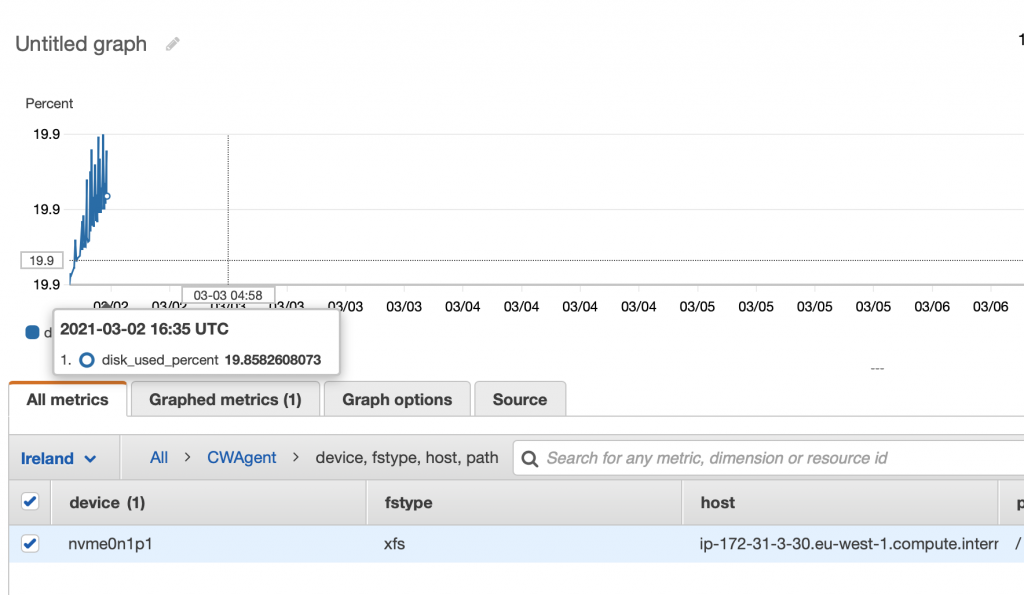
By clicking on each one, you can see the list of all the instances and the metric values for each one.
To see the logs you have to choose Logs -> Log groups within the Cloudwatch panel.
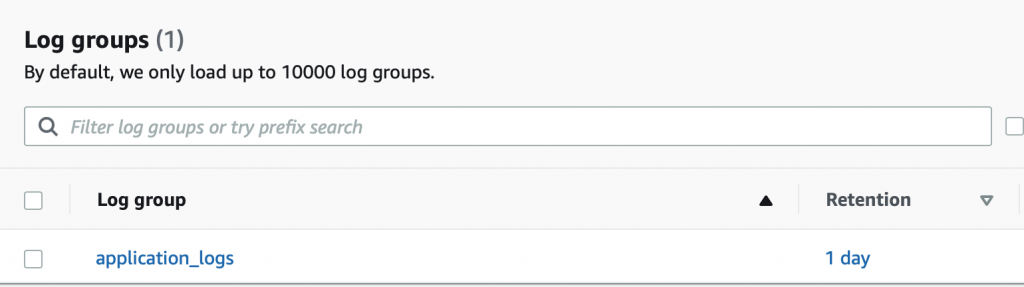
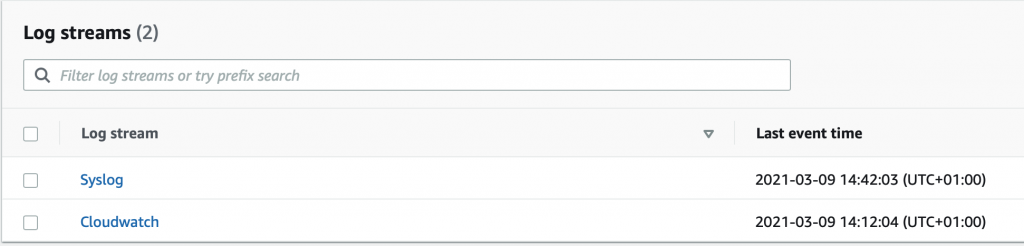
You can see the application_logs group that we have established within our main.tf configuration file. Within this group are two log streams: Syslog and Cloudwatch. Each log stream represents a file with the logs that is updated.
By clicking on each log stream you can see the updated content of each file.
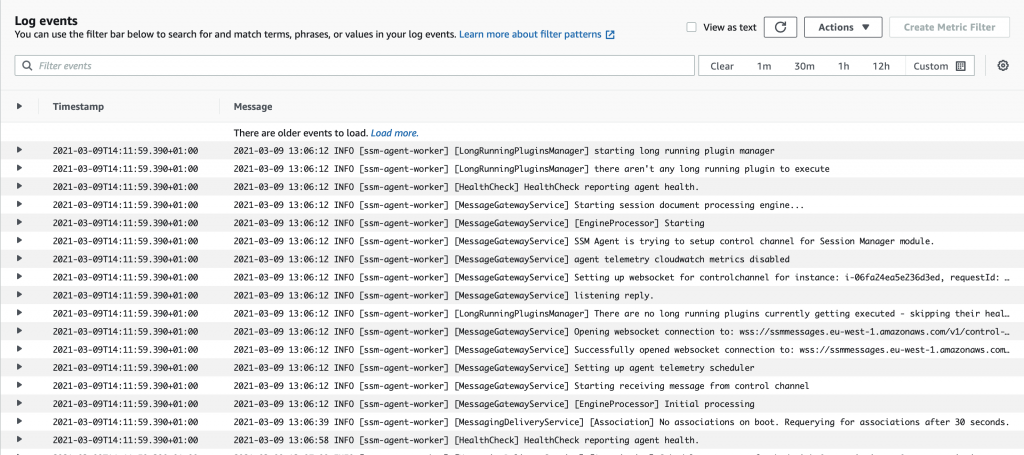
In this way, we can collect the logs we want from different instances and see them in a single place without going to the logs of each instance.
AWS Cloudwatch Free Tier
The AWS free tier gives you some services for free, but you have to be careful not to exceed the limits. You can see Cloudwatch pricing here.
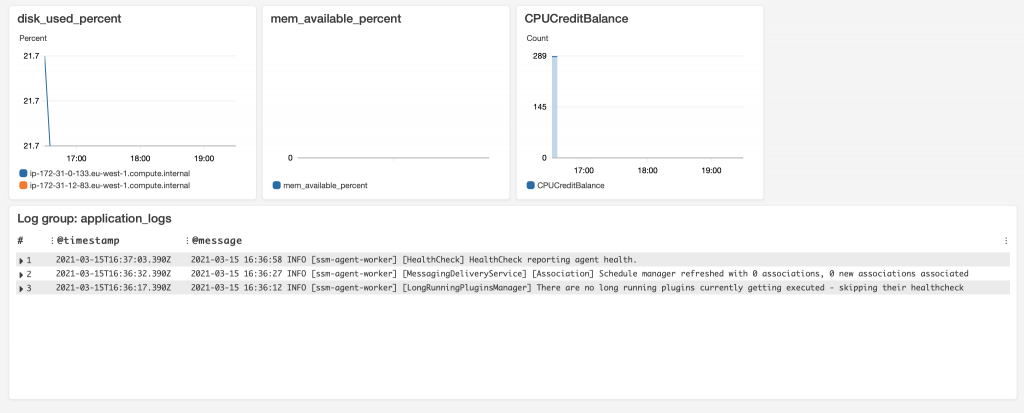
| Metrics | basic monitoring metrics (a metric that measures a value every 5 minutes) 10 detailed monitoring metrics (a metric that measures a value every minute) 1 million Cloudwatch API requests (not applicable to GetMetricData or GetMetricWidgetImage) | | --- | --- | | Dashboard | 3 dashboards for up to 50 metrics per month. A dashboard is a view that represents different metrics in the form of different widgets (charts or just text).
 |
| Alarms | 10 alarm metrics (does not apply to high-resolution alarms) An alarm monitors a single CloudWatch metric or the result of a metric-based mathematical expression. The alarm takes one or more actions based on the value of the metric or expression against a threshold over various time periods. A high resolution alarm is an alarm for a period of 10 seconds. The standard resolution for an alarm is 60 seconds. |
| Logs | 5 GB of data (ingestion, storage and archiving, and data scanned by Logs Insights queries) |
| Events | All events except custom events are included. Amazon EventBridgeprovides a near real-time stream of system events that describe changes to Amazon Web Services (AWS) resources. Using simple rules you can assign events and direct them to one or more flows. CloudWatch events learn about changes as they occur and respond to these changes by sending messages to respond to the environment, triggering functions, making changes, and capturing state information. All state events issued by AWS services are free. But if your app emits a custom event you have to pay 1 USD per 1 million events (depends on region). |
| Contributor Insights | 1 Contributor Insights rule per month The first million log events that match the rule per month Contributor Insight is used to analyze the logs and create rules that allow you to find the largest contributor to any error or event by analyzing the logs. A rule defines the log fields that you will use to determine the largest taxpayer, such as their IpAddress. |
| Synthetics | 100 canary runs per month Amazon CloudWatch Synthetics is used to create canaries, configurable scripts that run from time to time, to monitor URLs and APIs. Canaries follow the same routes and perform the same actions as a customer, allowing you to continually check a customer's experience even when you don't have customer traffic in your applications. By using canaries, you can discover problems before your customers do. Canaries are scripts written in Node.js or Python. They create the lambdas in your AWS account and work over the HTTP and HTTPS protocols. |
|
| Alarms | 10 alarm metrics (does not apply to high-resolution alarms) An alarm monitors a single CloudWatch metric or the result of a metric-based mathematical expression. The alarm takes one or more actions based on the value of the metric or expression against a threshold over various time periods. A high resolution alarm is an alarm for a period of 10 seconds. The standard resolution for an alarm is 60 seconds. |
| Logs | 5 GB of data (ingestion, storage and archiving, and data scanned by Logs Insights queries) |
| Events | All events except custom events are included. Amazon EventBridgeprovides a near real-time stream of system events that describe changes to Amazon Web Services (AWS) resources. Using simple rules you can assign events and direct them to one or more flows. CloudWatch events learn about changes as they occur and respond to these changes by sending messages to respond to the environment, triggering functions, making changes, and capturing state information. All state events issued by AWS services are free. But if your app emits a custom event you have to pay 1 USD per 1 million events (depends on region). |
| Contributor Insights | 1 Contributor Insights rule per month The first million log events that match the rule per month Contributor Insight is used to analyze the logs and create rules that allow you to find the largest contributor to any error or event by analyzing the logs. A rule defines the log fields that you will use to determine the largest taxpayer, such as their IpAddress. |
| Synthetics | 100 canary runs per month Amazon CloudWatch Synthetics is used to create canaries, configurable scripts that run from time to time, to monitor URLs and APIs. Canaries follow the same routes and perform the same actions as a customer, allowing you to continually check a customer's experience even when you don't have customer traffic in your applications. By using canaries, you can discover problems before your customers do. Canaries are scripts written in Node.js or Python. They create the lambdas in your AWS account and work over the HTTP and HTTPS protocols. |
# Budgets
In order to control AWS expenses, it is convenient to create a budget (budget) that notifies us about the current expense as we generate more requests, data, etc.
Let's go to the AWS console -> Billing -> Budgets and press the “Create budget” button.
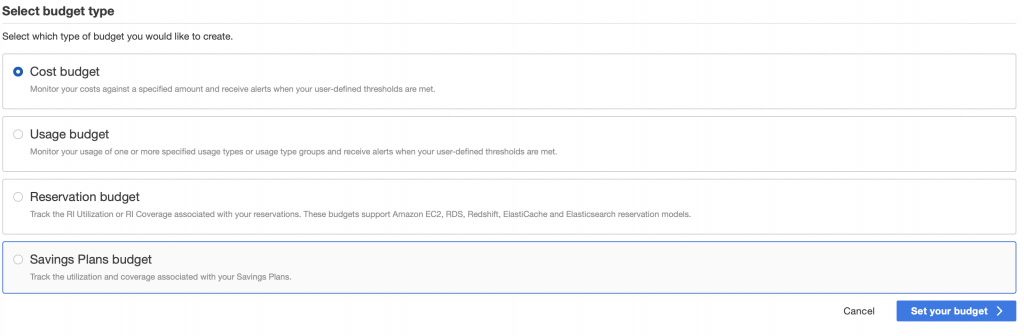
It gives us the option to choose the type of budget. Cost budgetallows us to control expenses. Usage budget allows us to control usage. You have to choose Usage type – Cloudwatchto see the types of usage you can observe. In the case of Cloudwatch, Amazon currently only allows you to control some parameters of the use of Cloudwatch such as requests or the volume of data processed, but not all. But we can create the budget with the usage type CW:Requests(Request) or EU-DataProcessingBytes(GB) to have an early warning in case we exceed the request or log size limit.
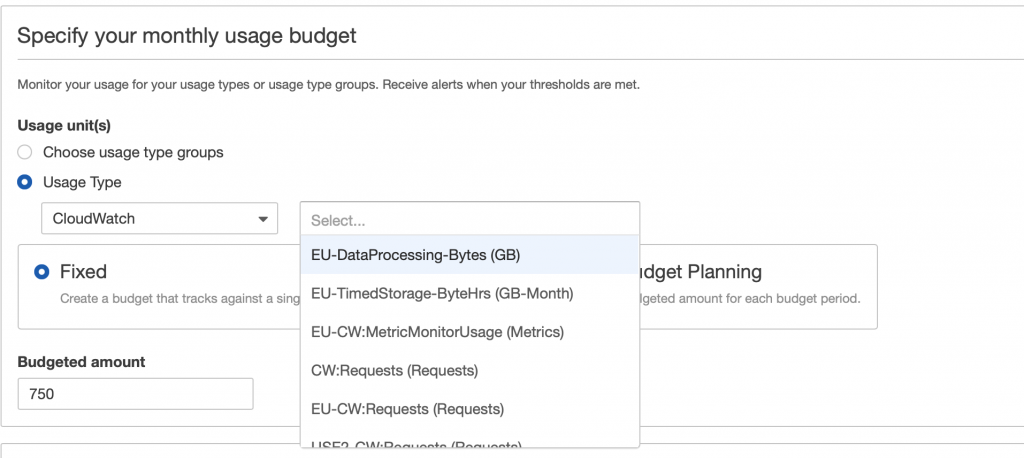
You can establish the budget (Budgeted amount) annually, monthly, quarterly, etc. Amazon gives you information about current consumption to be able to estimate the necessary budget for the future. Since Amazon Cloudwatch gives you 1 million Cloudwatch API requests you can divide 1 million by 12 months or set an annual budget of 1 million requests (Cloudwatch service is free, but there are limits). For the logs you can create another budget with the usage type TimedStorage with the limit of 5 gigabytes.
# Budget notifications
After establishing the budget, we have to set a notification threshold that determines when Amazon will notify us. It makes sense to set the threshold at 80% to be prepared for the budget to be exhausted. Unfortunately, there is no option to automatically stop the service that is going to exceed these limits, so it will be necessary to configure alerts and perform the action manually.
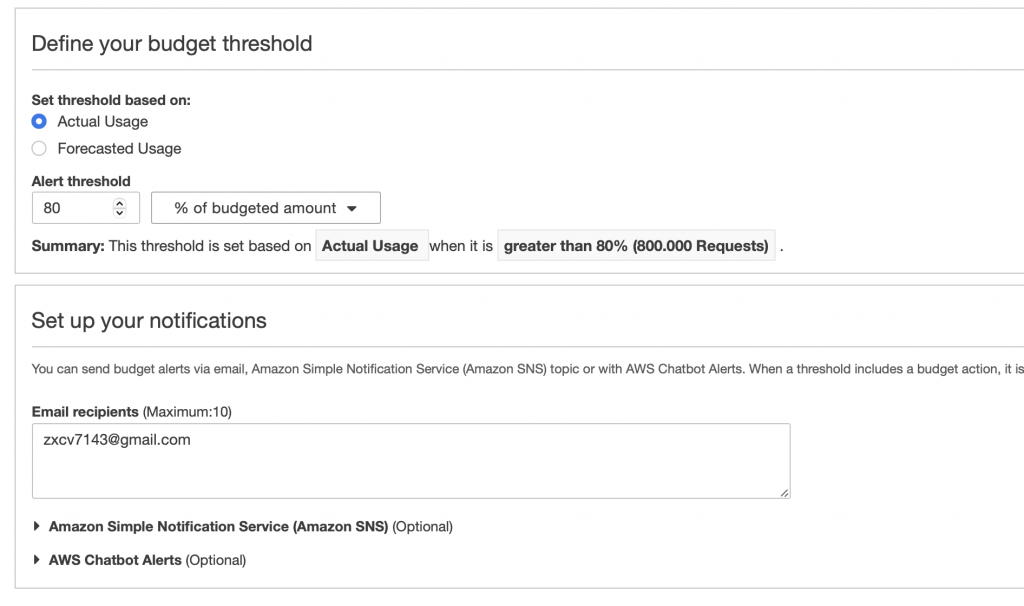
The last, but most important, is to establish the communication channels that Amazon will use to communicate the budget alert to you. You can directly create an email list or use Amazon SNS, which gives you many more options such as SMS, Lambda, HTTP, SQS, etc.
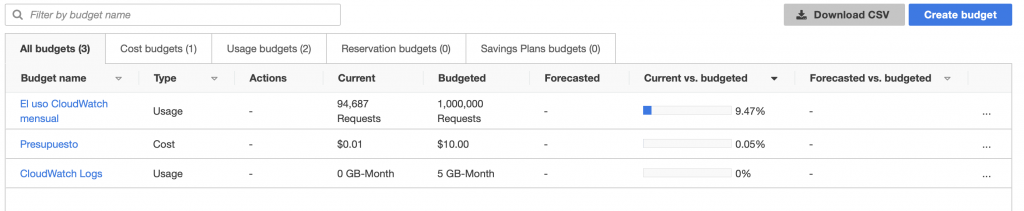
It is advisable, in addition to usage budgets, to also create cost budgets to be more sure of not exceeding spending limits. By creating a budget of 1 euro with early notice (for example at 50%) Amazon will notify you if you have used some of its services extensively and have exceeded the limits provided by the free tier.
Conclusions
In this article we have used Terraform to build an EC2 instance with Session Manager and Cloudwatch Agent permissions to display non-default metrics. We can also use the Cloudwatch agent to send our logs from different instances to the Cloudwatch log groups to centralize the entire log process. When you configure the Cloudwatch agent, it is important that you only define the metrics that are important to you because they are not free.
You can find the full code in the github repository.
If you want to continue learning about the topic, don't miss the tutorial Monitorizar applications in a Kubernetes cluster.